Overview
The Home screen provides an overview of the platform's live activity and a snapshot of your global security posture. It aggregates data from Simulations to surface key metrics, Findings, and coverage gaps in a single view.
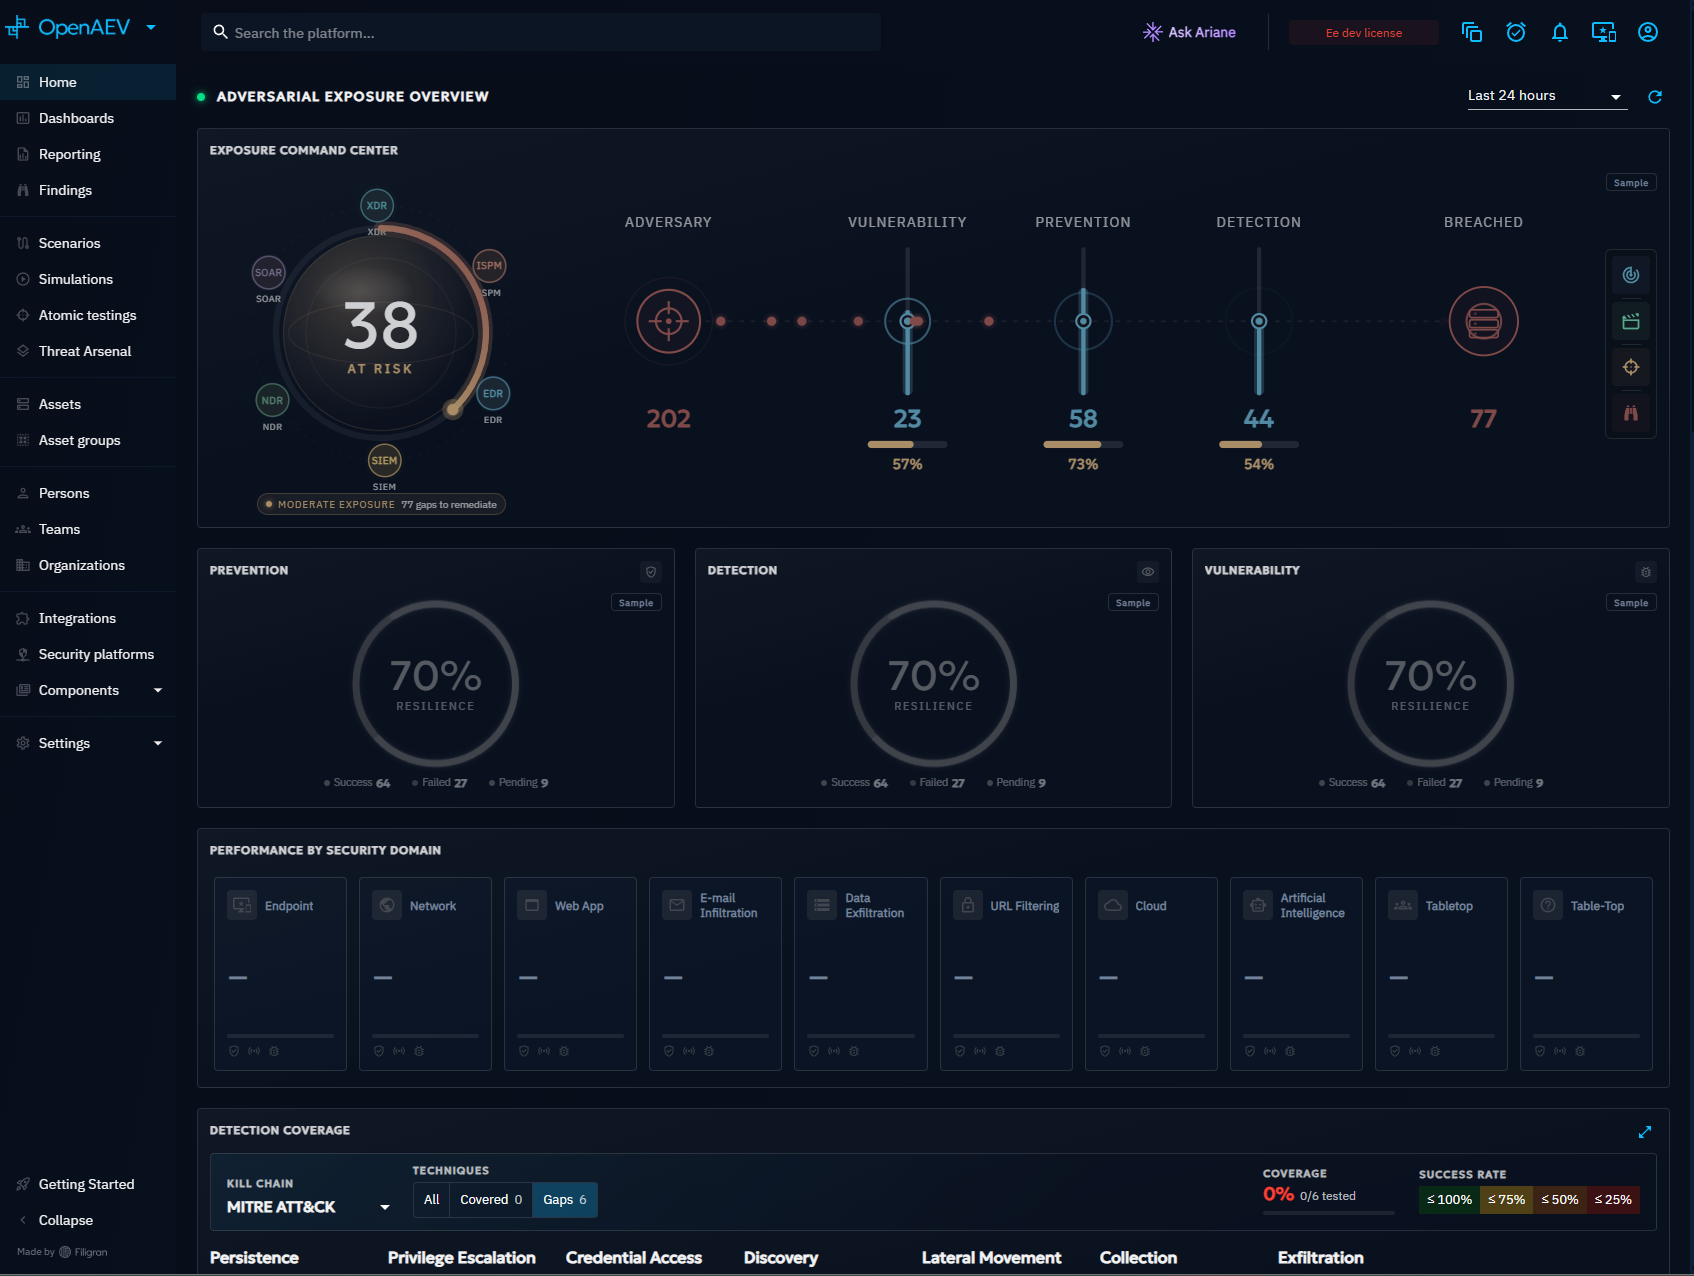
Adversarial exposure overview
The top section displays the Exposure Command Center: a central radar showing your overall risk score, surrounded by four key indicators:
- Vulnerability: number of detected CVEs and the percentage addressed
- Prevention: how many attack steps were blocked
- Detection: how many attack steps were detected
- Breached: attack steps that bypassed both prevention and detection
Below the command center, donut charts break down your prevention, detection, and vulnerability scores, and the Performance by Security Domain section shows how each domain (endpoint, network, email, etc.) performs.
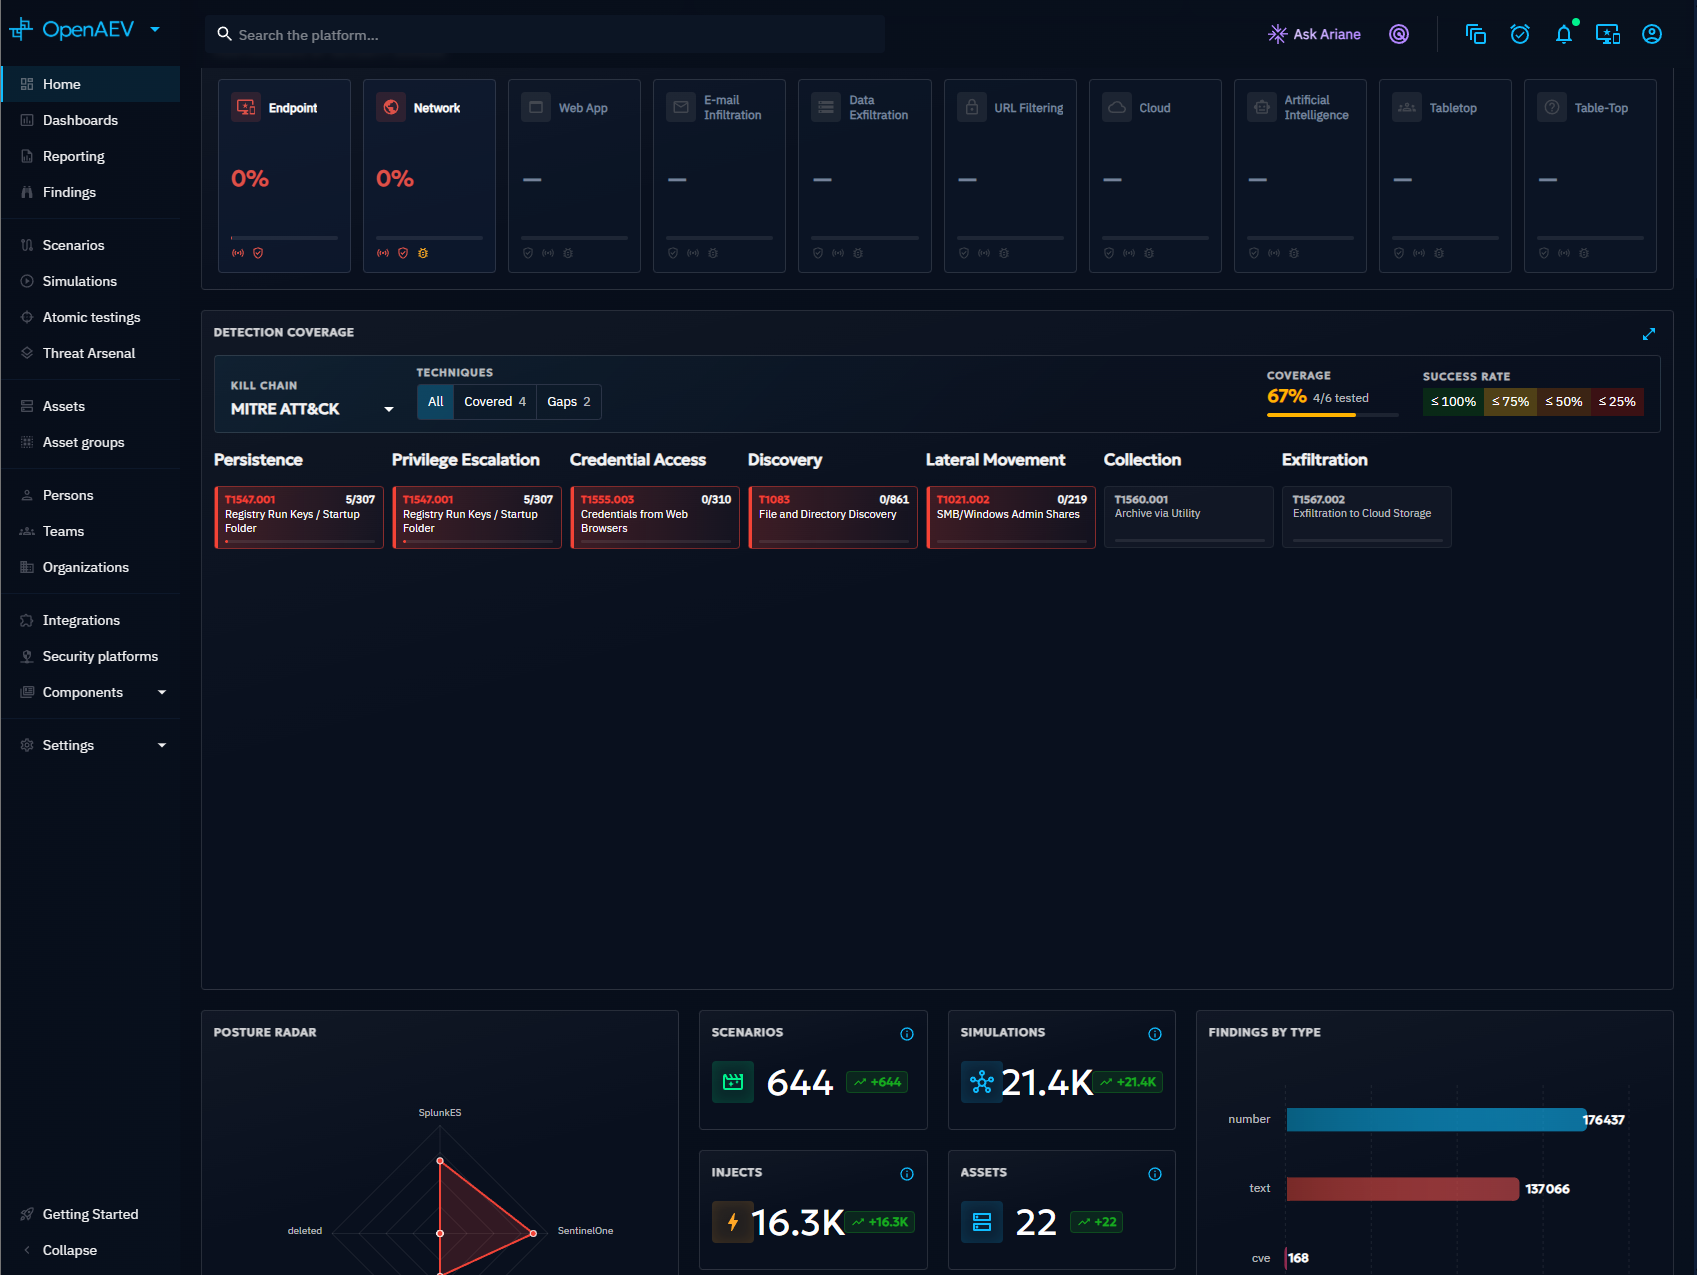
MITRE ATT&CK detection coverage
The MITRE ATT&CK matrix shows which tactics and techniques have been covered by your Simulations and how well they were handled. The matrix supports both Kill Chain and Techniques views, and displays coverage and success rates per technique.
Below the matrix, metric cards provide counts for the key platform objects: Scenarios, Simulations, Findings by type, Injects, and Assets.
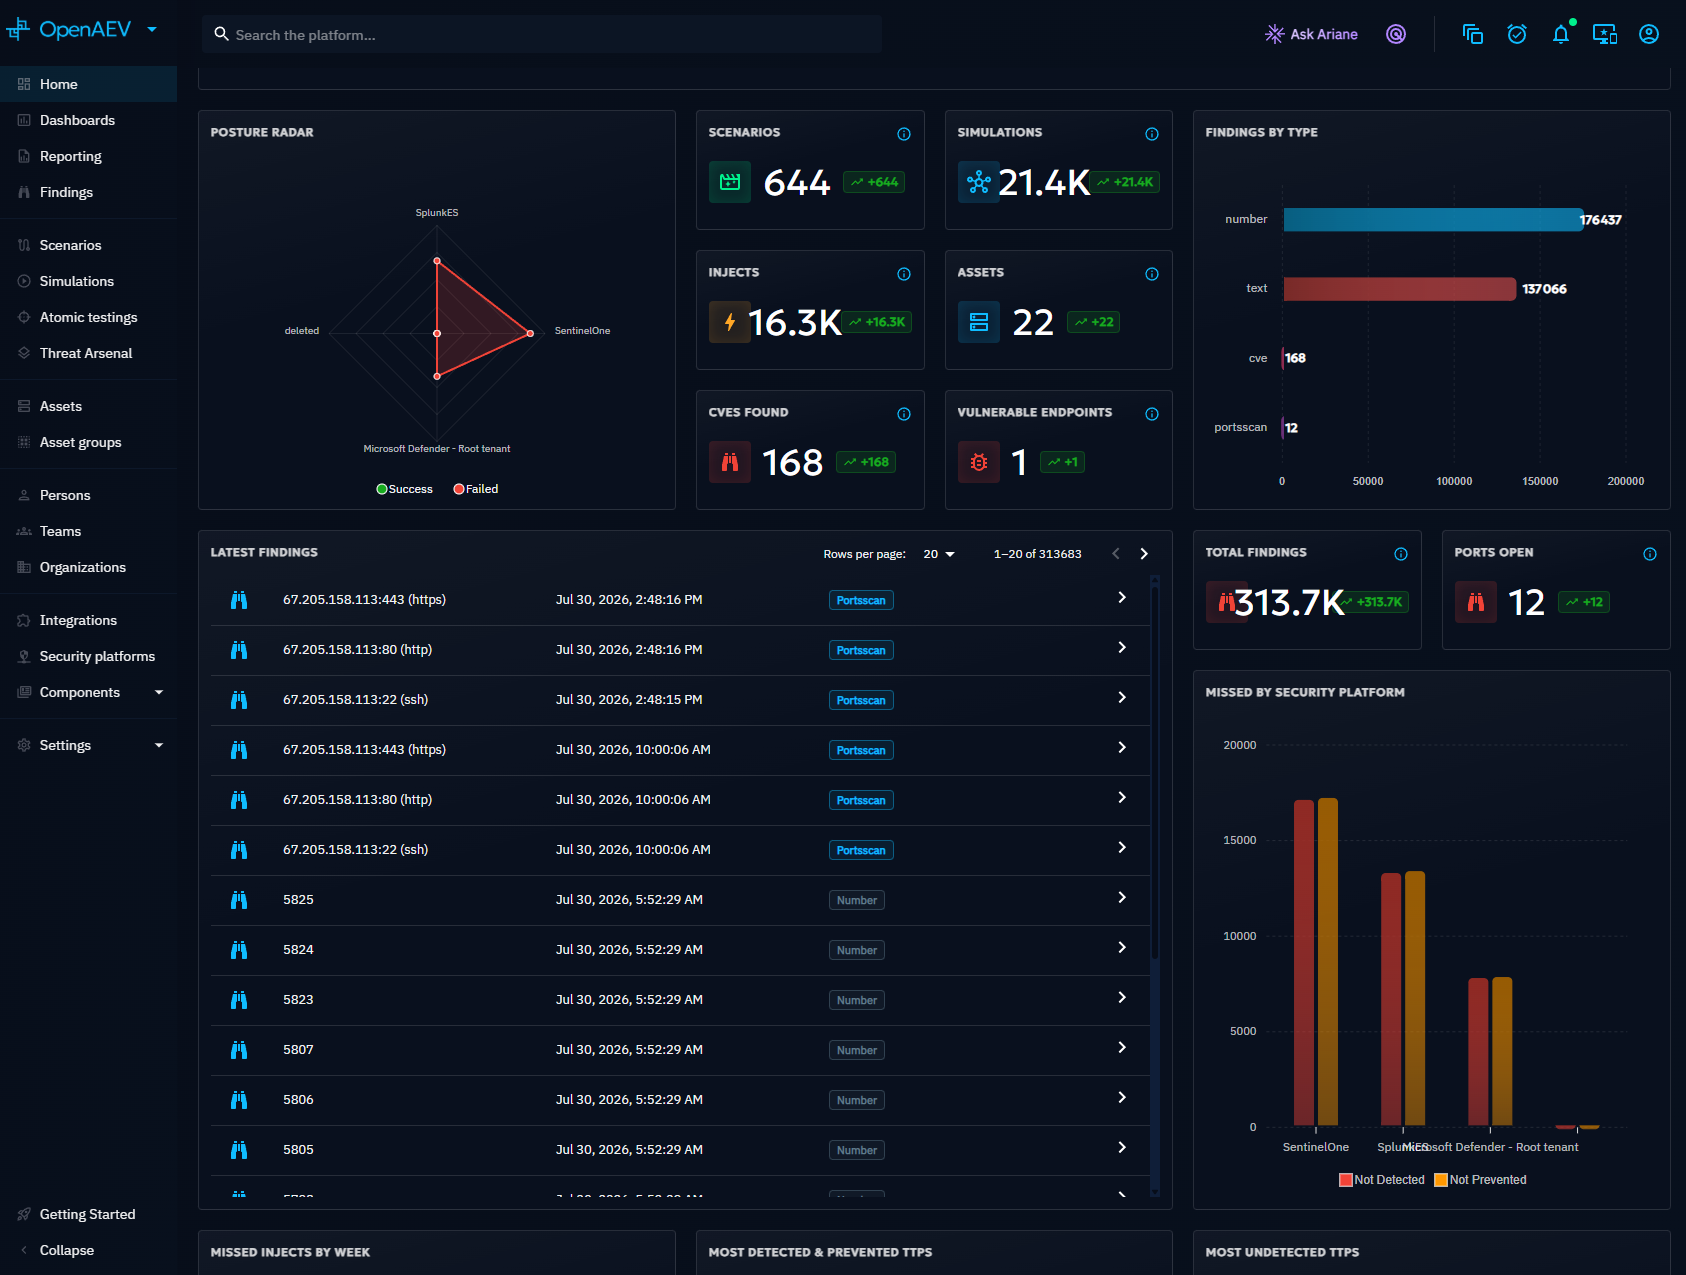
Findings and statistics
This section surfaces your latest Findings in a searchable table, alongside aggregate statistics:
- Total Findings and Ports discovered across all Simulations
- Missed by Security Platform: which security tools failed to detect or prevent attacks
- CVEs Found and Vulnerable Endpoints counts
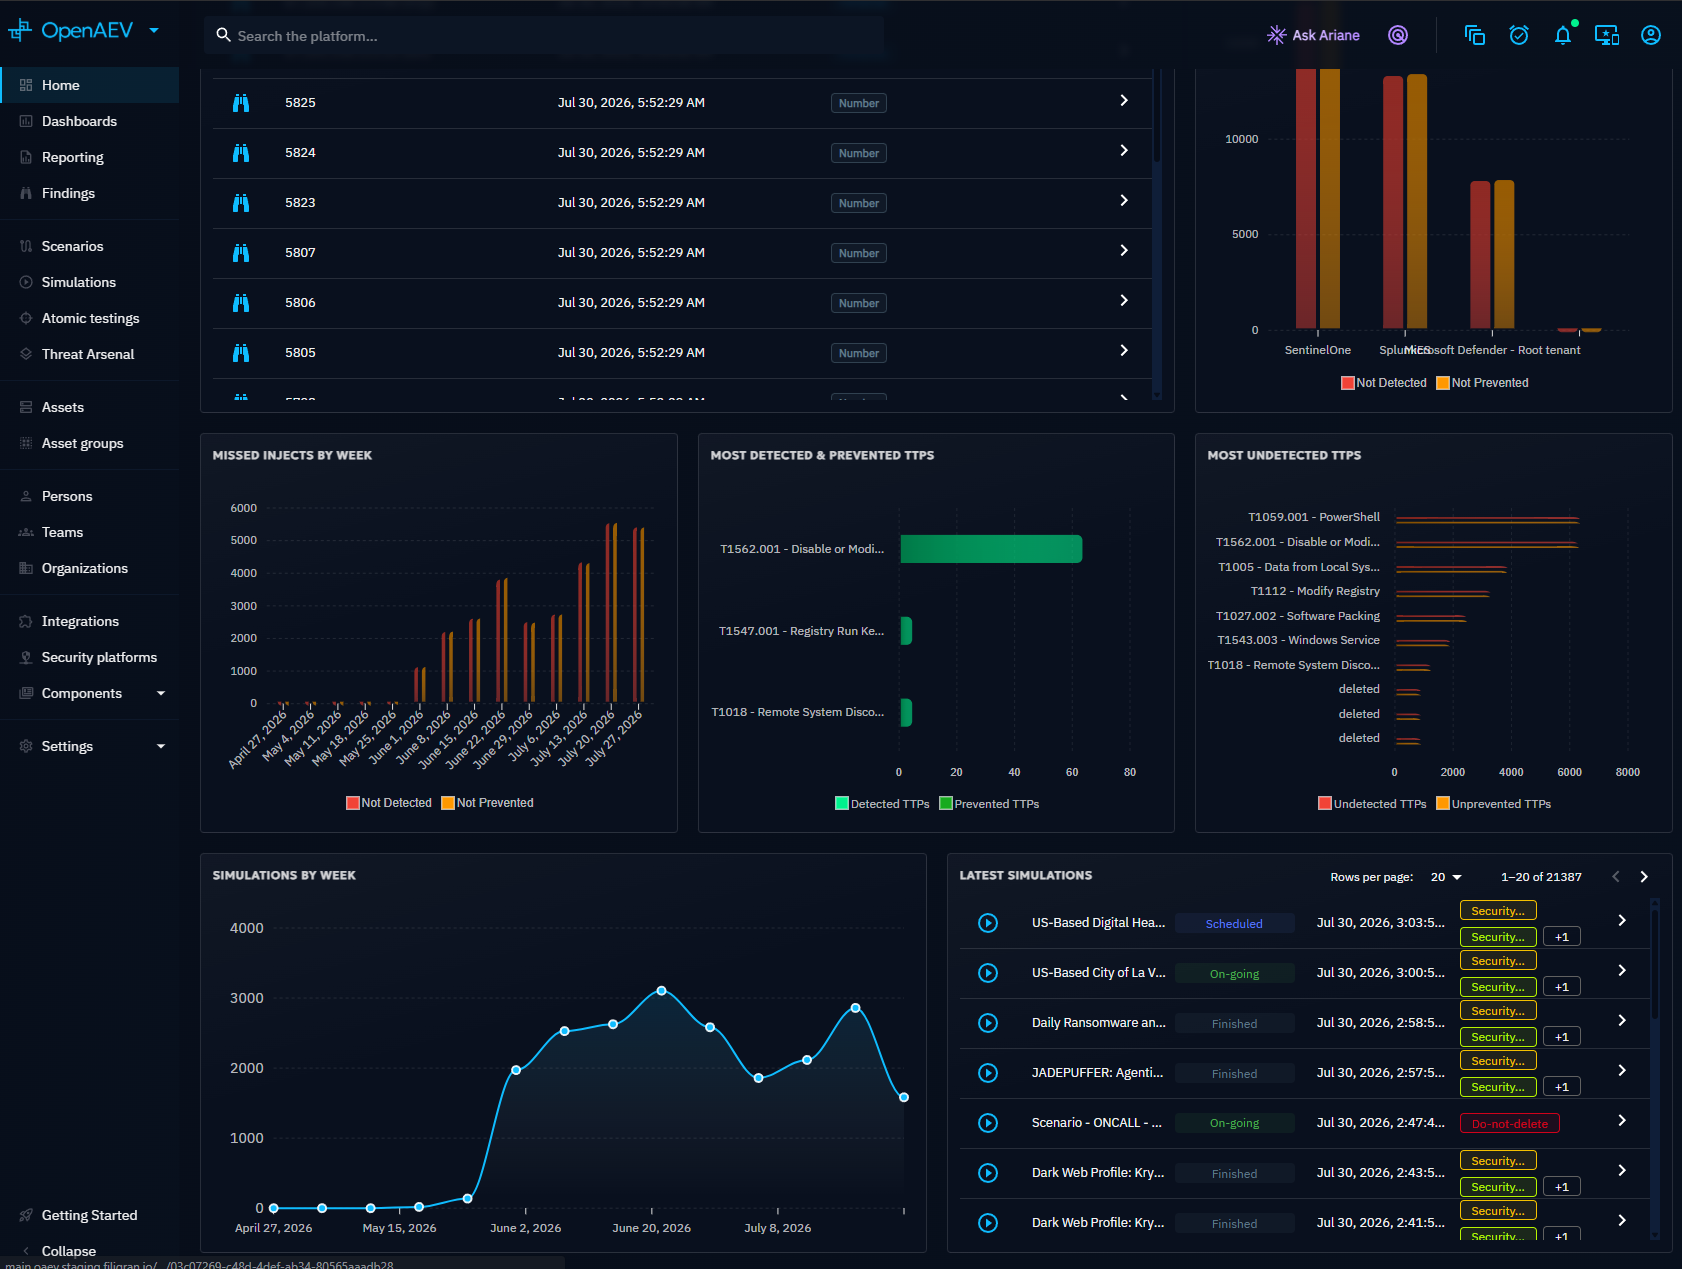
Trends and recent activity
The bottom section provides temporal views of your testing activity:
- Missed Injects by week: tracks undetected or unblocked Injects over time
- Most detected and prevented types: which attack types your stack handles best
- Most undetected types: where your gaps are
- Simulations by week: your testing cadence over time
- Latest Simulations: the most recent Simulation runs with their results
What's next?
- Scenarios and Simulations -- Understand the Scenario and Simulation workflow
- Custom Dashboards -- Build custom views of your data
- Findings -- Explore discovered vulnerabilities and exposures